
LegalPunkt Agentic Workspace: The Dashboard
LegalPunkt Dashboard is the central hub for your agentic legal project management. The Dashboard tab provides a comprehensive, AI-driven overview of your active legal matters, combining real-time metrics, system updates, and interactive timelines. It is designed to keep advocates and clients aligned on goals, costs, and key dates.
As soon as a user creates a project, they establish a project context that is fully understood by our agentic system. This system immediately assesses the matter's complexity (classifying it as Low, Medium, or Critical), estimates the time the case will take, outlines the necessary project phases, and projects the overall pricing. This upfront planning helps advocates navigate client expectations regarding the costs of their legal services. This context, containing all details generated by the AI agent based on the user's questions and queries within the project, is dynamically compiled and managed in the Billing Module.
This guide details every component of the Dashboard tab, explaining how to interpret the data, navigate related tabs, and interact with the LegalPunkt AI Agent.
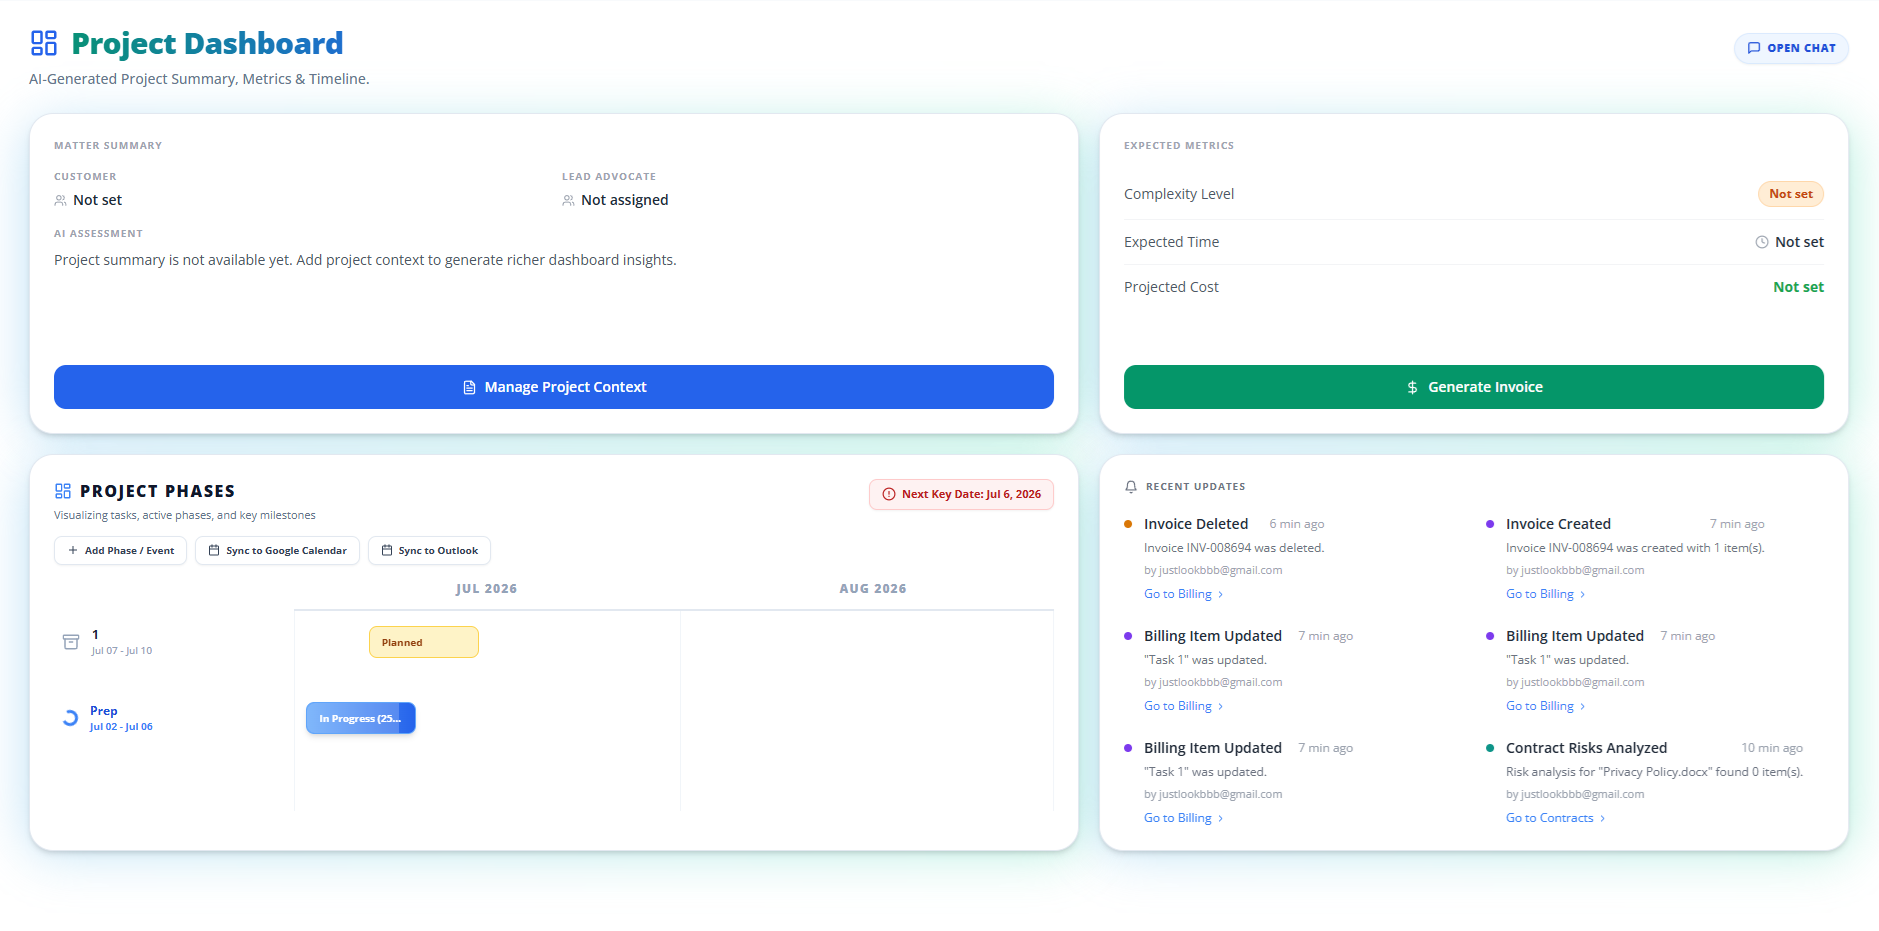
Strategic Overview and Metrics
The top row of your dashboard serves as the strategic hub, balancing qualitative insights with financial and scheduling estimates. Rather than relying on manual reporting, the AI agent dynamically generates all of these data points in a cohesive flow. It reviews the active project context to generate case summaries, assess the matter's overall complexity level, forecast expected billable hours, and calculate projected costs. From this unified interface, you can immediately identify critical areas of concern—such as key risk areas flagged in the AI-generated summary—while keeping track of the lead advocate and the client. To facilitate quick transitions, direct action buttons allow you to manage the project context or jump to the billing tab to generate invoice drafts based on these estimated metrics.
Recent Updates and Operational Audit Log
The dashboard houses a continuous activity feed that serves as a rigorous audit ledger for the entire project. Designed to maintain compliance and operational integrity, this component logs every operation performed by users within the workspace. Every necessary action is tracked—from document uploads and index processing to AI drafting sessions and manual text updates—ensuring a complete, verifiable record of the team's progress.
Each entry in this audit log features a visual indicator and timestamp to mark milestones. For example, when a new client file is indexed or a draft agreement is generated, the log displays the event with options to navigate directly to the source. These entries act as interactive shortcuts: clicking any logged operation instantly redirects counsel to the relevant tab or document, streamlining the verification workflow.
Project Phases and Timeline
At the foundation of the dashboard is the Project Phases view, a visual waterfall timeline that maps the strategic path of the matter. This chronological layout displays key milestones, overlapping legal phases, and task dependencies over time. A prominent indicator highlights the next critical date—such as an upcoming court hearing or a pleading deadline—to ensure the team remains ahead of schedule.
The timeline organizes tasks by their active state, showing which phases are completed, currently in progress, or planned for future execution. This structured presentation allows partners to assess the current pace of work and plan resources accordingly. Furthermore, the timeline is fully interactive: users can add new phases or milestones directly to the grid and synchronize them with external calendars like Google Calendar or Microsoft Outlook, keeping all external stakeholders aligned.